
CS2 MARKET REPORT · November 18, 2026

CS2 Market Report: Weekly Prices and Activity

Each week: the most traded skins, StatTrak premiums, cross-market price gaps and the most expensive items, plus the biggest 7-day price moves when a full week of daily prices is available. Past weeks stay in the archive exactly as they were published.

Est. catalog value$20.95M▼ 1.42% vs last week
Items tracked28,107
Catalog composition
Knives45.83%
Weapon skins30.37%
Cases10.83%
Stickers6.43%
Gloves4.52%
Agents1.15%

Most traded this week

Units sold on Steam over seven days; turnover is units sold multiplied by the item’s price.

By units sold (7d)

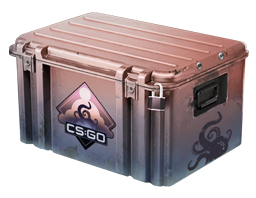
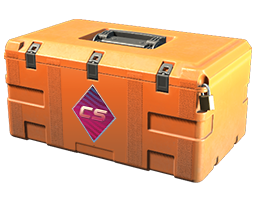
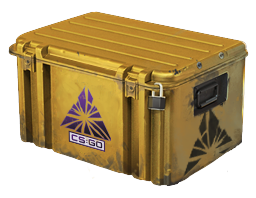
1Dreams & Nightmares Case889.7k sold · $1.43$1.28M
2Revolution Case619.2k sold · $0.17$102k
3Kilowatt Case534.2k sold · $0.11$59k
4Sealed Dead Hand Terminal364.2k sold · $0.21$76k
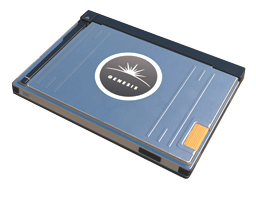
5Sealed Genesis Terminal251.1k sold · $0.05$12k
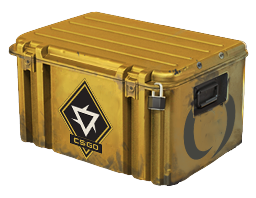
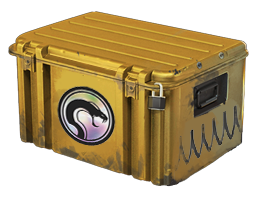
6Fever Case236.5k sold · $0.64$150k
7Fracture Case130.5k sold · $0.40$52k
8Recoil Case119.4k sold · $0.25$30k

By turnover (7d)

1Dreams & Nightmares Case889.7k sold · $1.43$1.28M
2Fever Case236.5k sold · $0.64$150k
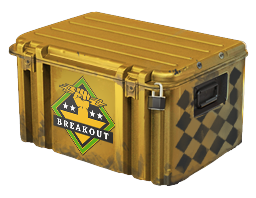
3Operation Breakout Weapon Case13.5k sold · $8.73$118k
4Glove Case11.0k sold · $9.34$103k
5Revolution Case619.2k sold · $0.17$102k
6Spectrum 2 Case29.7k sold · $3.21$96k
7Chroma 3 Case20.3k sold · $3.85$78k
8Sealed Dead Hand Terminal364.2k sold · $0.21$76k

Biggest movers of the week

Where the best price lives

How often each marketplace has the lowest price for an item (Tradeit excluded). This is not a share of sales.

Buff16333.25%
Steam17.38%
DMarket14.26%
Skinport11.23%
SkinBaron8.68%
HaloSkins8.64%
Market.CSGO4.87%
Waxpeer1.68%

Price distribution

Tracked items by their current best (lowest multi-market) price.

< $135.82%
$1 – 1030.02%
$10 – 5015.91%
$50 – 20011.51%
$200 – 1k5.73%
$1k+1.01%

StatTrak™ premium this week

Widest cross-market price gaps

The same skin, priced very differently across marketplaces — where arbitrage-style research starts.

All price gaps →

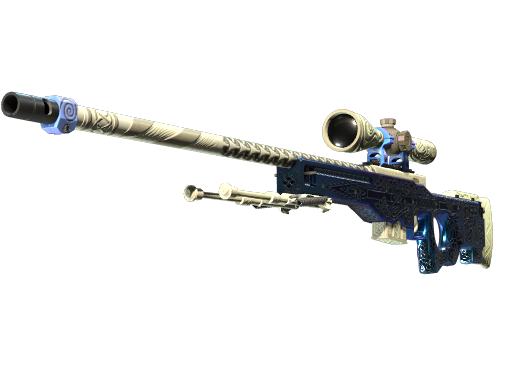
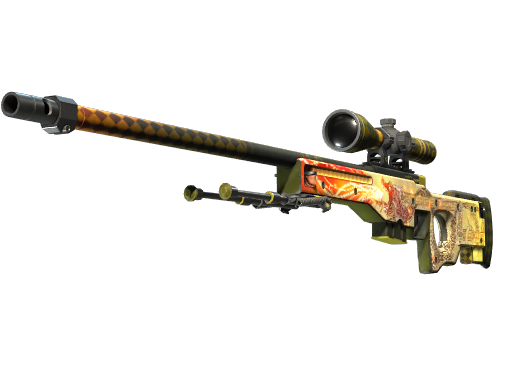
Most expensive items this week

Ranked by each item’s priciest variant across wears, StatTrak and Doppler phases.

Full top-100 →

Report archive

Every weekly report stays online — browse how the market looked in earlier weeks. Get new reports by RSS

Methodology & sources

How each number is built is explained below. Archived weeks keep the figures they were published with.

Cosmetic market research desk with report sheets, category samples and calendar.
Read a market report alongside its data period, coverage and comparison method.

Read each metric on its own terms

The report combines our market cap index, Steam sales counts, daily prices and price gaps between marketplaces. The index tracks how prices move; it is not a count of every inventory or the cash value of every CS2 item. Read a weekly change together with the two dates it compares.

Cheapest-market share counts how often each marketplace has the lowest price for an item; Tradeit is left out because its prices are in store credit. It shows where the best price appears most often, not how much each marketplace sells. Balances on the other marketplaces are not all withdrawable cash either.

What would make a weekly signal convincing?

We would look for a move that repeats across marketplaces and has enough sales behind it, then check the exact wear before acting. Turnover multiplies Steam units sold by the item’s price, so it estimates trading value rather than adding up receipts. Missing marketplaces and old prices can change the picture.

If a variant is listed at $100 and $150, the comparison uses the $100 minimum; this filters out most bad prices, though not all of them. The most-expensive ranking uses each skin’s priciest tracked variant, including StatTrak and Doppler phases. Unique crafts and record sales are outside its scope.

Questions about this tool

Are old weekly figures recalculated using today’s prices?

No. Each archived week keeps the figures it was published with; later fixes to these explanations do not change them.