CS2 investment calculator and portfolio tracker
Record your CS2 holdings, enter the price paid per item and compare their current value. The tracker calculates portfolio value, gross profit or loss and percentage return before selling and withdrawal fees.
Some marketplace links are affiliate links. How we earn
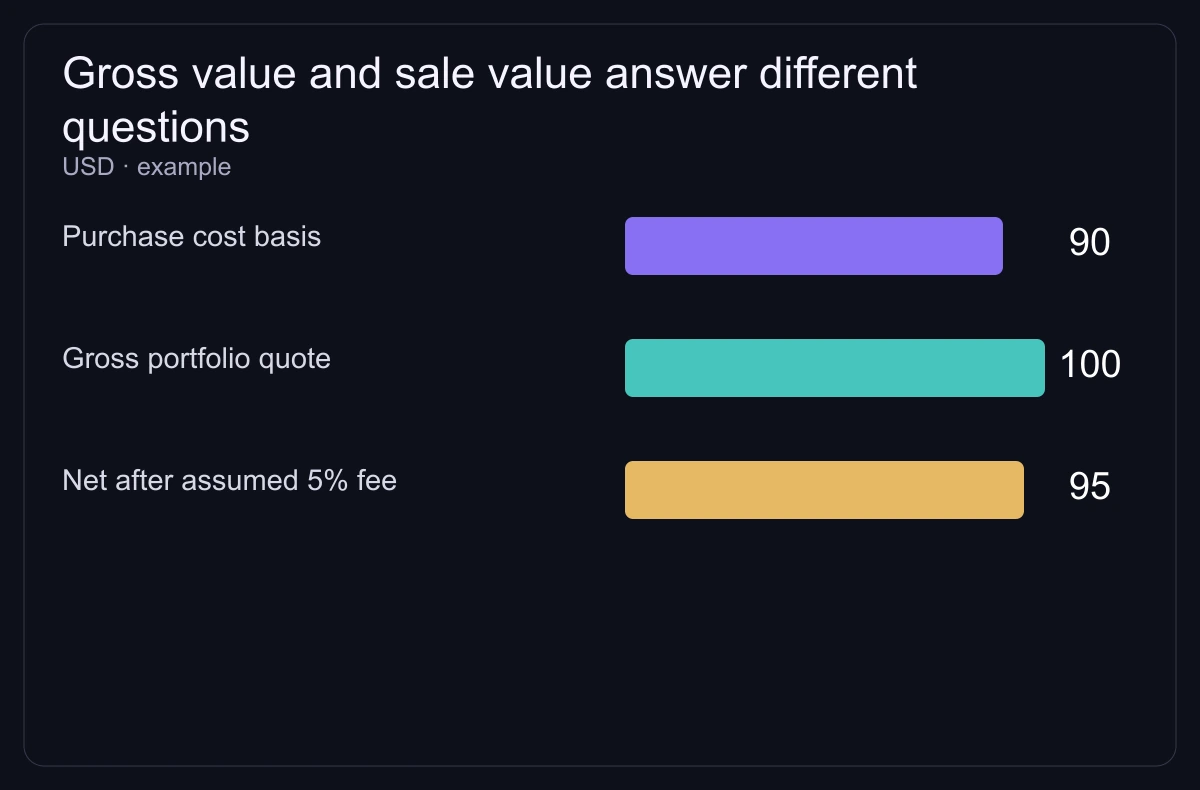
Values are before fees. Holdings without a current quote count as zero in total current value: review these rows before interpreting portfolio P&L.

Add a holding and check the numbers
Track items available in search: skins, knives, gloves, stickers, cases, capsules and agents. The tracker records positions you add; it does not import your Steam inventory or execute trades.
- Choose Add holding, search for an item and select the exact name and wear where available.
- Enter quantity and buy price per unit in USD. A new entry starts at quantity 1; buy price is blank and must be greater than zero.
- Wait for the price to load, then review Current price. You can enter a manual estimate per unit before saving.
- Save the position. Edit lets you change quantity or either price and keeps the existing values. Check totals after each change.
Record purchases at different prices as separate holdings or calculate your own weighted average buy price. The tracker does not reconstruct transaction history.
Read portfolio value, P&L and return
Invested value is quantity × buy price; current value is quantity × current price. Gross P&L is current value minus invested value. Portfolio return is gross P&L ÷ invested value × 100, not the simple average of individual holding returns.
Example: ten items bought at $20 each and valued at $25 each give $200 invested, $250 current value and $50 gross P&L (+25%).
| Metric | Calculation | Result |
|---|---|---|
| Invested value | 10 × $20 | $200 |
| Current value | 10 × $25 | $250 |
| Gross P&L | $250 − $200 | +$50 |
| Gross return | $50 ÷ $200 × 100 | +25% |
| Value after an 8% selling fee | $250 × 0.92 | $230 |
| P&L after that fee, before other costs | $230 − $200 | +$30 (+15%) |
The last two rows are a separate example: the tracker does not deduct this fee. Its win rate is the share of holding rows with positive gross P&L, not a probability of future profit.
Choose a price source and check the item
DMarket mode prefers its own price, then the lowest supported third-party price, then Steam. Steam mode prefers Steam but can fall back to a third-party price. Lowest third-party mode falls back to Steam. Check the marketplace beside each available price rather than assuming every holding uses the selected market.
A price belongs to the market name, not to your exact item, and it is not the amount a sale will pay you. If an exact wear price is missing, lookup can use the base-name price; Dragon Lore can also use its Factory New price. Check the variant, float, pattern, stickers and a current listing before treating the value as a sale estimate.
Steam proceeds remain Steam Wallet funds and cannot be withdrawn to a bank account. Steam-based portfolio value is therefore not the cash amount available from a third-party sale.
Changing the price source, refreshing prices or reloading the portfolio can replace manual current prices with feed values. Review your manual scenario after these actions.
Handle missing quotes and preserve your records
An unavailable current quote is shown as unavailable in the holding row. However, totals still count its purchase cost and treat its missing current value as zero. This can make total P&L look worse than the known-price positions. Check every unavailable row before interpreting totals; enter a documented manual estimate when appropriate.
Holdings are saved in this browser’s local storage, not a synced account. Export CSV before clearing browser data or switching devices. A shared portfolio opens separately; importing it adds holdings to your portfolio, so check for duplicates.
Before selling, check the current sell offer, commission, withdrawal cost, currency conversion and trading restrictions. A higher displayed price alone does not mean a better cashout.
Check the sell amount after costs
Compare an available offer, selling commission, withdrawal cost and restrictions for your country.