
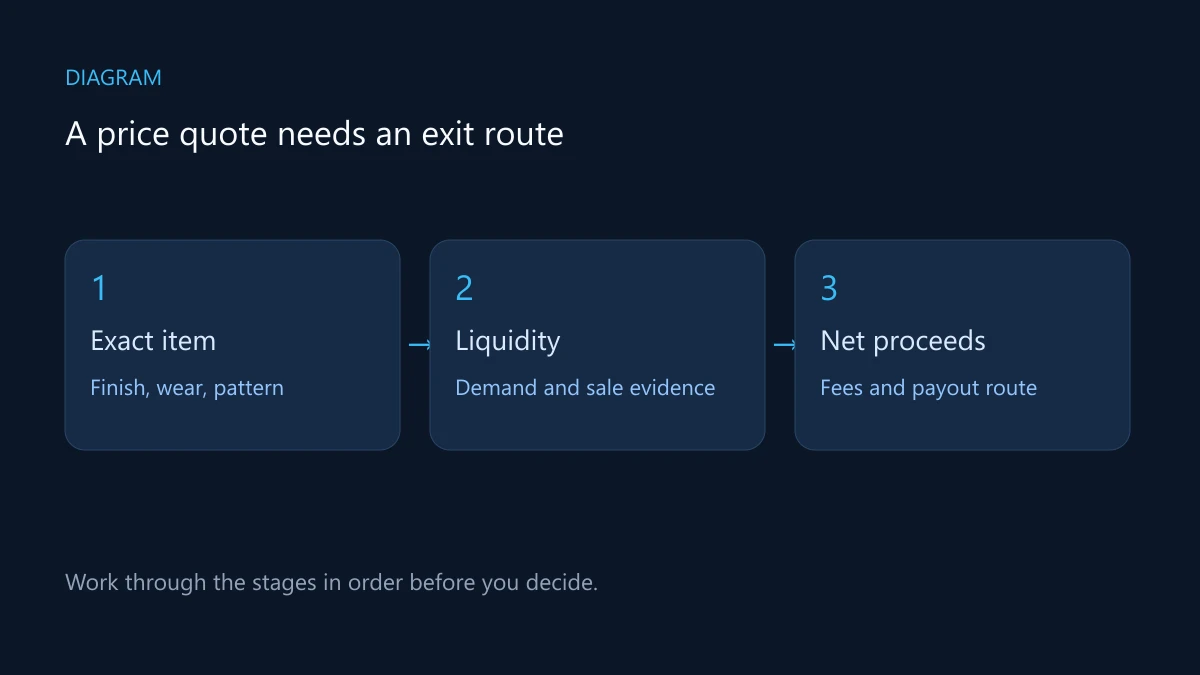
CS2 skin market analysis comes down to three checks on the exact item: what it sells for across marketplaces, how many copies actually sell, and what you keep after fees. A market-wide index shows the direction of the market, not the price of your skin.
Check 1: the price of the exact item
Match the weapon, finish, wear and normal, StatTrak™ or Souvenir version. The price table compares the same item across up to nine marketplaces, and every skin page in the skins database lists each marketplace’s price per wear and marks the lowest. When float, pattern or stickers matter, compare copies with the same attributes; the float guide shows how.
A listing is what a seller asks; a sale is what a buyer paid. Where a marketplace shows completed sales, use those.

Check 2: how many copies sell
Each skin page shows how many copies sold on Steam in the last 30 days and how many listings are in our price feed. Few sales against many listings means a sale at the listed price can take a while. If you hold ten copies, one cheap listing is not the price for all ten.
Check 3: what you keep after fees
Example: you bought 10 identical skins at $20 each and can sell all ten at $25 on a marketplace that takes 8% of the sale.
- Purchase cost: 10 × $20 = $200.
- Sale value: 10 × $25 = $250.
- Fee: $250 × 8% = $20, so you receive $230.
- Profit: $230 − $200 = $30, or 15%.
The price rose 25%, but the profit is 15%. At the same fee, the break-even price is $200 ÷ (10 × 0.92) ≈ $21.74 per skin.
| Sale price per skin | Sale value | After 8% fee | Profit or loss |
|---|---|---|---|
| $18 | $180 | $165.60 | −$34.40 / −17.2% |
| $20 | $200 | $184 | −$16 / −8% |
| $25 | $250 | $230 | +$30 / +15% |
The general formula: profit = quantity × sale price × (1 − fee) − withdrawal cost − purchase cost. Each marketplace’s fee is in the marketplace fee guide.
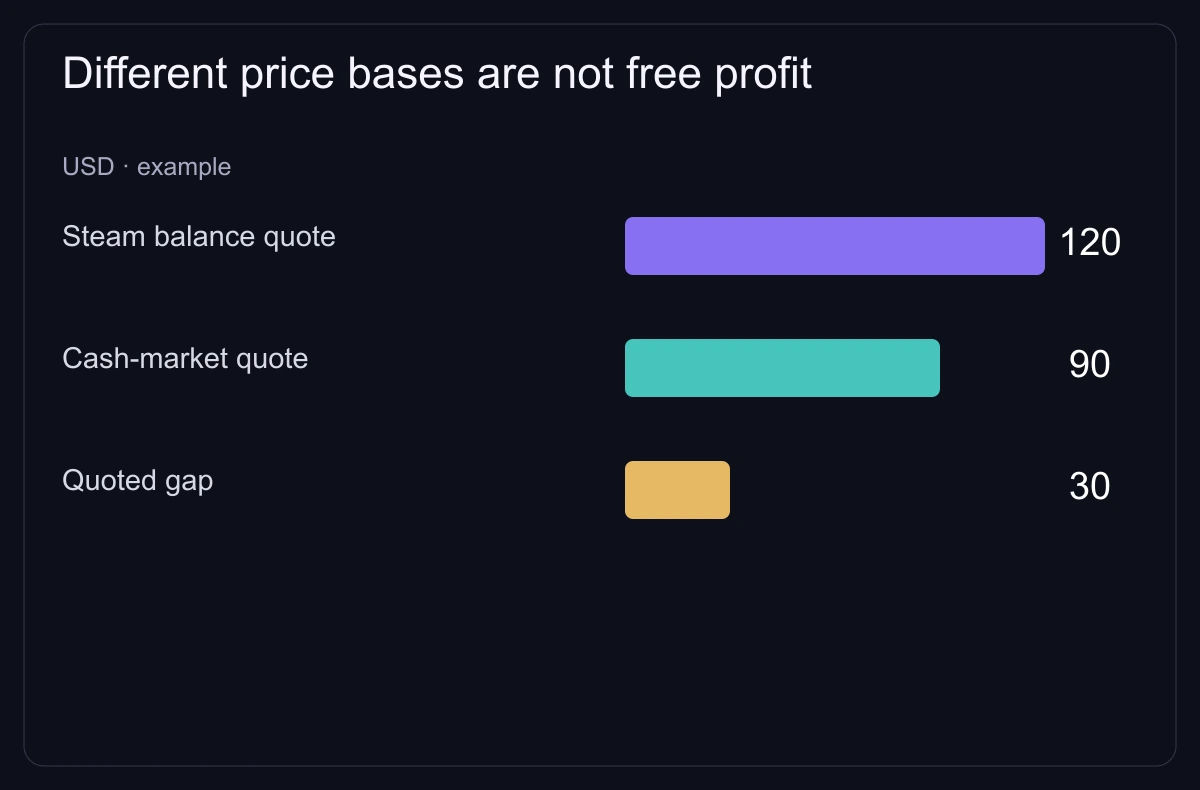
Sales on the Steam Community Market pay into your Steam Wallet, and Valve’s Steam Subscriber Agreement says Wallet funds have no cash value and can’t be exchanged for cash. $230 in Wallet funds and a $230 cash payout are different results.
Where the market cap index fits
The CS2 market cap index shows how the value of CS2 items moves overall and by category: knives, weapon skins, gloves, cases, stickers and agents. Use it to see whether a move in your item is part of a wider trend. A category can rise while your item falls. What the index measures is explained in the methodology.
Track a position in the investment calculator
The investment calculator keeps your quantities and purchase prices and values them at DMarket prices by default; you can switch to Steam or to the lowest third-party price. It shows value and profit before selling fees, so take your marketplace’s fee off as in check 3.
A research note in one line
Item and attributes, quantity, date, marketplace, price (listing or sale), Steam sales per month, purchase cost and what you would keep after fees. With that saved, a later price change can’t rewrite your reasons.