
















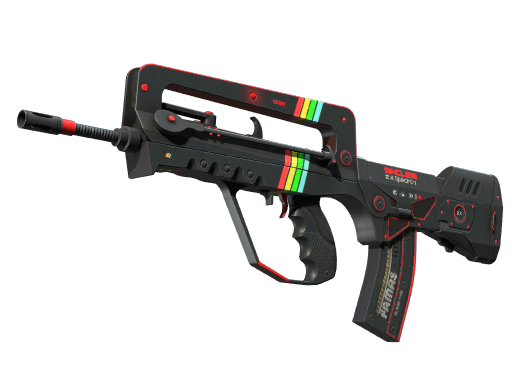





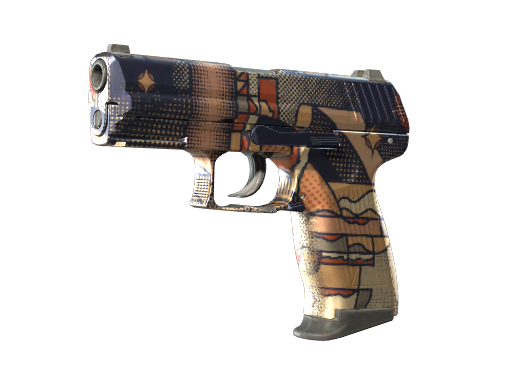

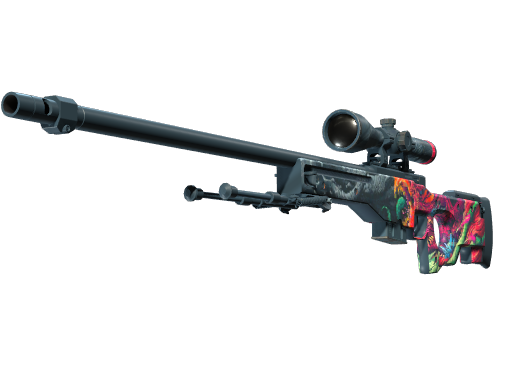




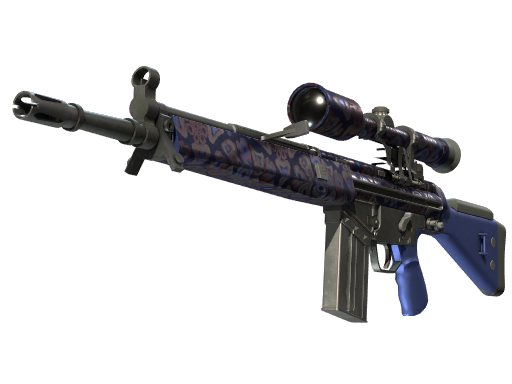























The comparison depends on the available history
The tool compares the latest price with an earlier price from the chosen window and ranks changes of at least 0.5%. If the full window is not available yet, the earliest recorded price becomes the baseline, so a “7-day” change can cover fewer days for a newer skin.
Our first check is the chart and its dates. The lowest price can also move because a different marketplace or wear became the cheapest. Compare the same variant on the same market before interpreting a jump as a genuine change in demand.
A percentage needs an absolute price
A move from $0.10 to $0.15 is +50%; a move from $100 to $105 is +5%. The first leads a percentage ranking, but its five-cent difference can disappear in rounding or fees. Record both the dollar change and percentage when comparing candidates.
Look into a move using current listings, recent sales and any related official update. If the price data is old, the window is short or the listing is gone, leave the cause open. One chart is not enough to call a lasting trend.
Questions about this tool
Does a gainer mean I should buy?
No. The ranking shows a past price change. Your entry price, future demand and selling costs are separate questions.